NCERT Solutions for Class 9 Maths Chapter 14 Statistics Ex 14.1 are part of NCERT Solutions for Class 9 Maths . Here we have given NCERT Solutions for Class 9 Maths Chapter 14 Statistics Ex 14.1.
NCERT Solutions for Class 9 Maths Chapter 14 Statistics Ex 14.1
Ex 14.1 Class 9 Maths Question 1.
Give five examples of data that you collect from your day-to-day life.
Solution:
Following are the five examples which are related to day-to-day life :
- Number of girl students in our class.
- Number of computer sets in our computer lab.
- Telephone bills of our house for last two years.
- Number of students appeared in an examination obtained from newspapers.
- Number of female teachers in all the schools in a state obtained from the education department.
Ex 14.1 Class 9 Maths Question 2.
Classify the data in Q.1 above as primary or secondary data.
Solution:
We have,
Primary data: (i), (ii) and (iii)
Secondary data: (iv) and (v)
NCERT
Solutions
Ex 14.2 Class 9 Maths Question 1.
The blood groups of 30 students of class VIII are recorded as follows
A, B, O, O, AB, O, A, O, B, A, O, B, A, O, O,
A, AB, O, A, A, O, O, AB, B, A, O, B, A, B, O
Represent this data in the form of a frequency distribution table. Which is the most common and which is the rarest blood group among these students?
Solution:
The required frequency distribution table is
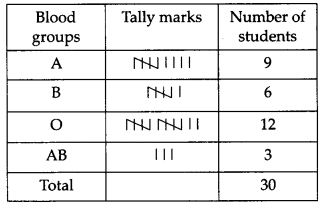
From the above table, we have The most common blood group is O. The rarest blood group is AB.
Ex 14.2 Class 9 Maths Question 2.
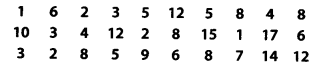
The distance (in km) of 40 engineers from their residence to their place of work were found as follows
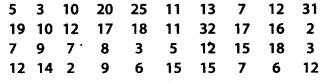
Construct a grouped frequency distribution table with class size 5 for the data given above taking the first interval as 0-5 (5 not included). What main features do you observe from this tabular representation?
Solution:
Here, the observation with minimum and maximum values are 2 and 32 respectively.
∴ The class intervals are as follows:
0 – 5, 5 – 10, 10 – 15, 15 – 20, 20 – 25, 25 – 30, 30 – 35
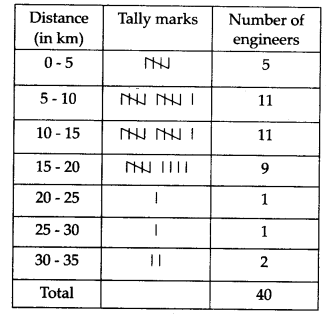
The required frequency distribution table is
From the above table we observe that:
(i) Frequencies of class intervals 5-10 and 10 – 15 are equal, i.e., 11 each. It shows that maximum number of engineers have their residences at 5 to 15 km away from their work place.
(ii) Frequencies of class intervals 20 – 25 and 25 – 30 are also equal, i.e., 1 each. It shows that minimum number of engineers have their residences at 20 to 30 km away from their work place.
Ex 14.2 Class 9 Maths Question 3.
The relative humidity (in %) of a certain city for a month of 30 days was as follows
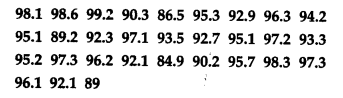
(i) Construct a grouped frequency distribution table with classes 84-86, 86-88 etc.
(ii) Which month or season do you think this data is about?
(iii) What is the range of this data?
Solution:
Here, the lowest value of observation = 84.9
The highest value of observation = 99.2
So, class intervals are 84 – 86, 86 – 88, 88 – 90, ……. , 98 – 100
(i) Thus, the required frequency distribution table is
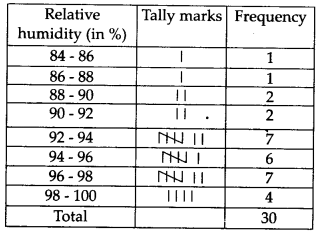
(ii) Since, the relative humidity is high during the rainy season, so, the data appears to be taken in the rainy season.
(iii) Range = (Highest observation) – (Lowest observation) = 99.2 – 84.9 = 14.3
Ex 14.2 Class 9 Maths Question 4.
The heights of 50 students, measured to the nearest centimeters have been found to be as follows
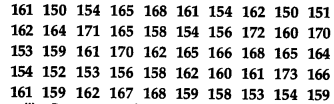
(i) Represent the data given above by a grouped frequency distribution table, taking class intervals as 160 – 165, 165 – 170 etc.
(ii) What can you conclude about their heights form the table?
Solution:
(i) Here, the lowest value of the observation = 150
The highest value of the observation = 173
∴ Class intervals are 150 – 155, 155 -160, …, 170 – 175.
The required frequency distribution table is
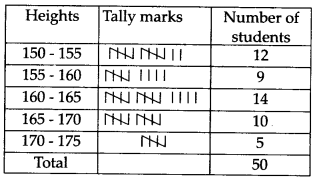
(ii) From the above table, we can conclude that more than 50% of the students are shorter than 165 cm.
Ex 14.2 Class 9 Maths Question 5.
A study was conducted to find out the concentration of sulphur dioxide in the air in parts per million (ppm) of a certain city. The data obtained for 30 days is as follows
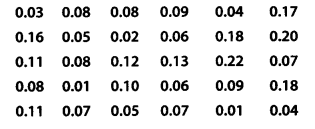
(i) Make a grouped frequency distribution table for this data with class intervals as 0.00 – 0.04, 0.04 – 0.08 and so on.
(ii) For how many day’s was the the concentration of sulphur dioxide more than 0.11 parts per million ?
Solution:
(i) Here, the lowest value of the observation = 0.01
The highest value of the observation = 0.22
∴ Class intervals are 0.00 – 0.04, 0.04 – 0.08,……., 0.20 – 0.24
The required frequency distribution table is
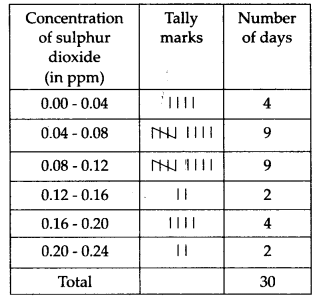
(ii) The concentration of sulphur dioxide was more than 0.11 ppm for 8 days.
Ex 14.2 Class 9 Maths Question 6.
Three coins were tossed 30 times simultaneously. Each time the number of heads occurring was noted down as follows
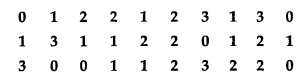
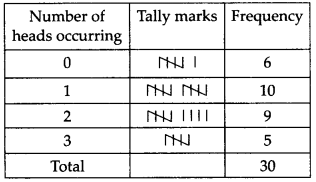
Prepare a frequency distribution table for the data given above.
Solution:
The required frequency distribution table is
Ex 14.2 Class 9 Maths Question 7.
The value of π upto 50 decimal places is given below
3.14159265358979323846264338327950288419716939937510
(i) Make a frequency distribution of the digits from 0 to 9 after the decimal point.
(ii) What are the most and the least frequently occurring digits?
Solution:
(i) The required frequency distribution table
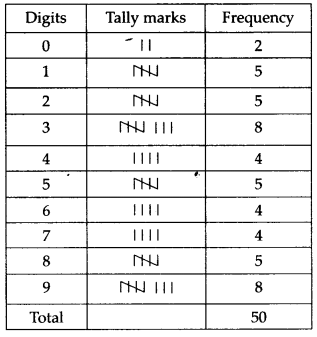
(ii) The most frequently occurring digits are 3 and 9 and the least frequently occurring digit is 0.
Ex 14.2 Class 9 Maths Question 8.
Thirty children were asked about the number of hours they watched TV programmes in the previous week.
The results were found as follows
(i) Make a grouped frequency distribution table for this data, taking class width 5 and one of the class intervals as 5 – 10.
(ii) How many children watched television for 15 or more hours a week?
Solution:
(i) Here, the lowest value of the observation = 1 and the highest value of the observation = 17
∴ Class intervats are 0 – 5, 5 – 10 ., 15 – 20
The required frequency distribution table is
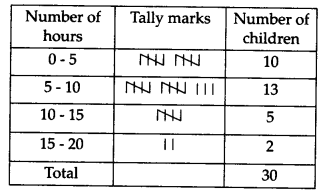
(ii) Number of children who watched television for 15 or more hours in a week = 2.
Ex 14.2 Class 9 Maths Question 9.
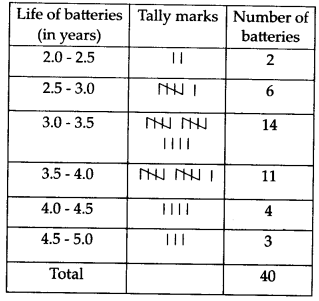
A company manufactures car batteries of a particular type. The lives (in years) of 40 such batteries were recorded as follows
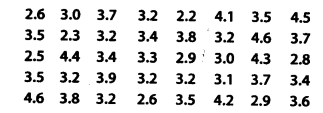
Construct a grouped frequency distribution table for this data, using class intervals of size 0.5 starting from the interval 2 – 2.5.
Solution:
Here, the lowest value of the observation = 2.2
and the highest value of the observation = 4.6
∴ Class intervals are 2.0 – 2.5, 2.5 – 3.0, …., 4.5 – 5.0
The required frequency distribution table is
for
Ex 14.3 Class 9 Maths Question 1.
A survey conducted by an organisation for the cause of illness and death among the women between the ages 15-44 (in years) worldwide, found the following figures (in %)
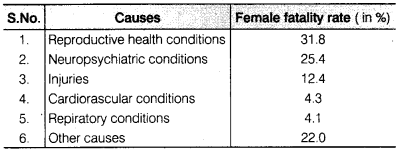
(i) Represent the information given above graphically.
(ii) Which condition is the major cause of women’s ill health and death worldwide?
(iii) Try to find out, with the help of your teacher, any two factors which play a major role in the cause in (ii) above being the major cause.
Solution:
(i) The required graphical representation is shown as follows:
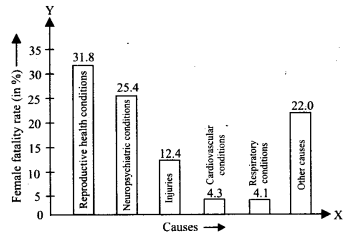
(ii) The major cause of women’s ill health and death worldwide is ‘reproductive health conditions’.
(iii) Two factors may be un education and poor background.
Ex 14.3 Class 9 Maths Question 2.
The following data on the number of girls (to the nearest ten) per thousand boys in different sections of Indian society is given below
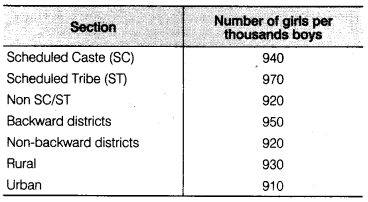
(i) Represent the information above by a bar graph.
(ii) In the classroom discuss, what conclusions can be arrived at from the graph.
Solution:
(i) The required bar graph is shown below:
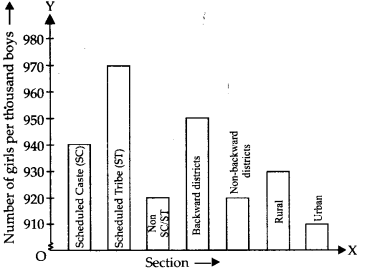
(ii) We conclude that number of girls per thousand boys are maximum in scheduled tribe section whereas minimum in urban section.
Ex 14.3 Class 9 Maths Question 3.
Given below are the seats won by different political parties in the polling outcome of a state assembly elections
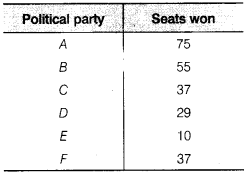
(i) Draw a bar graph to represent the polling results.
(ii) Which political party won the maximum number of seats?
Solution:
(i) The required bar graph is shown below:
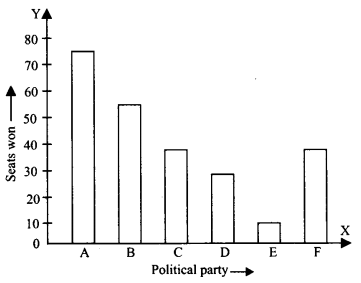
(ii) The political party A won the maximum number of seats.
Ex 14.3 Class 9 Maths Question 4.
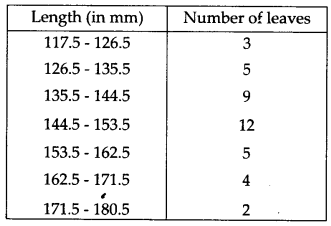
The length of 40 leaves of a plant measured correct to one millimetre and the obtained data is represented in the following table
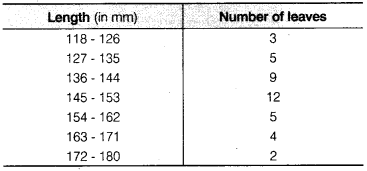
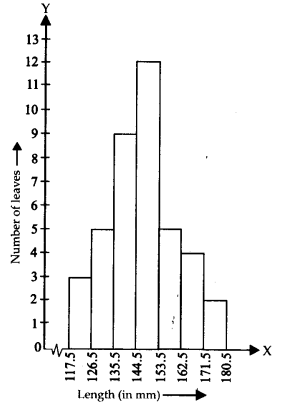
(i) Draw a histogram to represent the given data.
(ii) Is there any other suitable graphical representation for the same data?
(iii) Is it correct to conclude that the maximum number of leaves 153 mm long and Why?
Solution:
(i) The given frequency distribution table is not continuous. Therefore, first we have to modify it to be continuous distribution.
Thus, the modified frequency distribution table is:
Now, the required histogram of the frequency distribution is shown below :
(ii) Yes, other suitable graphical representation is a ‘frequency polygon’.
(iii) No, it is not a correct statement. The maximum number of leaves lie in the class interval 145 – 153.
Ex 14.3 Class 9 Maths Question 5.
The following table gives the lifetimes of 400 neon lamps
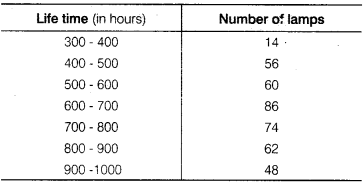
(i) Represent the given information with the help of a histogram.
(ii) How many lamps have a lifetime of more 700 h?
Solution:
(i) The required histogram is shown below:
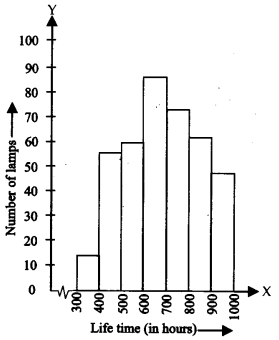
(ii) Number of lamps having life time of more than 700 hours = 74 + 62 + 48 = 184.
Ex 14.3 Class 9 Maths Question 6.
The following table gives the distribution of students of two sections according to the marks obtained by them
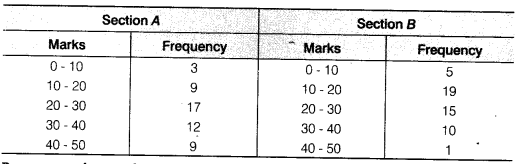
Represent the marks of the students of both the sections on the same graph by two frequency polygons. From the two polygons compare the performance of the two sections.
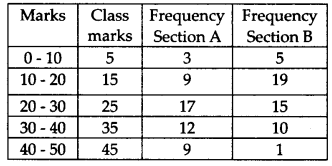
Solution:
To draw a frequency polygon, we mark the class marks along x-axis. Therefore, the modified table is:
So, the two frequency polygons are as shown below:
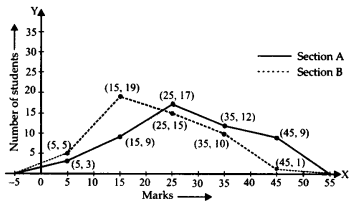
From the above frequency polygon, we can see that more students of section A have secured good
Ex 14.3 Class 9 Maths Question 7.
The runs scored by two teams A and B on the first 60 balls in a cricket match are given below
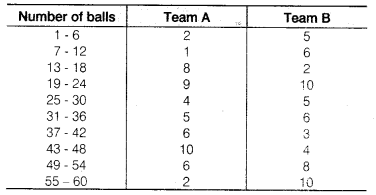
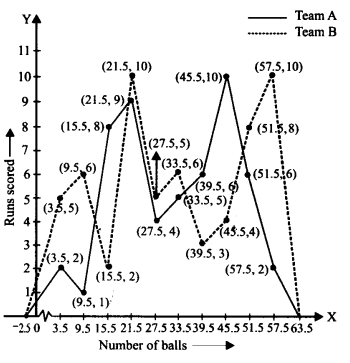
Represent the data of both the teams on the same graph by frequency polygons.
Solution:
The given class intervals are not continuous. Therefore, we first modify the distribution as continuous.
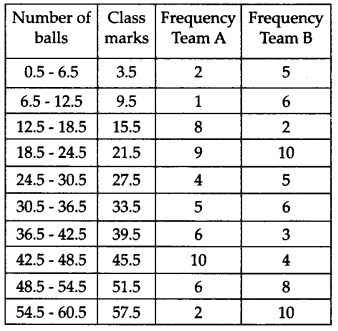
Now, the required frequency polygons are as shown below:
Ex 14.3 Class 9 Maths Question 8.
A random survey of the number of children of various age groups playing in a park was found as follows:
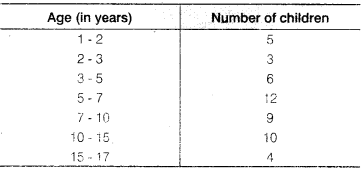
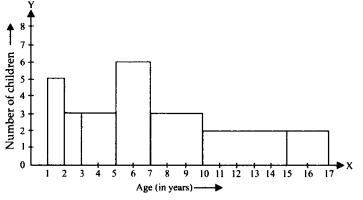
Draw a histogram to represent the data above.
Solution:
Here, the class sizes are different. So, we calculate the adjusted frequencies corresponding to each rectangle i.e., length of the rectangle.
Adjusted frequency or length of the rectangle
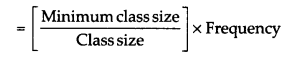
Here, the minimum class size = 2 – 1 = 1
∴ We have the following table for adjusted frequencies or length of rectangles:
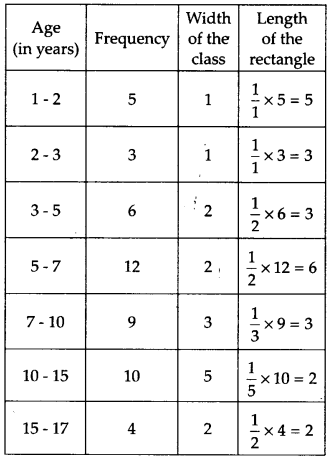
Now, the required histogram is shown below:
Ex 14.3 Class 9 Maths Question 9.
100 surnames were randomly picked up from a local telephone directory and a frequency distribution of the number of letters in the English alphabet in the surnames was found as follows
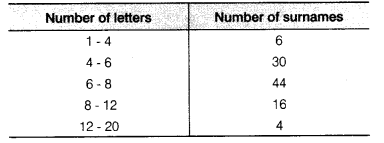
(i) Draw a histogram to depict the given information.
(ii) Write the class interval in which the maximum number of surnames lie.
Solution:
(i) Since, class intervals of the given frequency distribution are unequal, and the minimum class size = 6 – 4 = 2.
Therefore, we have the following table for length of rectangles.
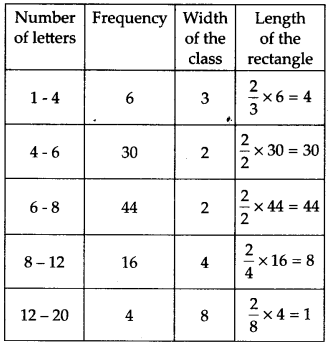
The required histogram is shown below:
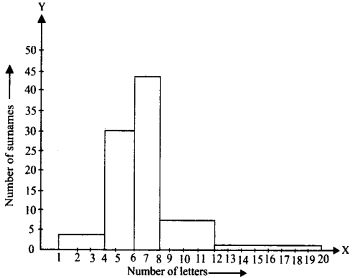
(ii) The maximum frequency is 44, which is corresponding to the class interval 6 – 8.
∴ Maximum number of surnames lie in the class interval 6 – 8.
Class
Ex 14.4 Class 9 Maths Question 1.
The following number of goals were scored by a team in a series of 10 matches
2, 3, 4, 5, 0, 1, 3, 3, 4, 3.
Find the mean, median and mode of these scores.
Solution:
To find the mean :
Here, n = 10
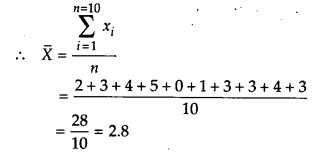
Thus, mean = 2.8
To find median:
Now arranging the given data in ascending order,
we have 0,1, 2, 3, 3, 3, 3, 4, 4, 5
∵ n = 10, an even number
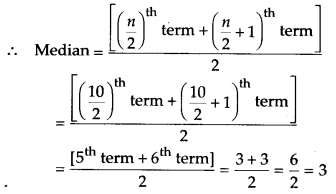
Thus, median = 3
To find mode:
In the given data, the observation 3 occurs 4 times,
i.e., maximum number of times.
Thus, mode = 3
Ex 14.4 Class 9 Maths Question 2.
In a mathematics test given to 15 students, the following marks (out of 100) are recorded
41, 39, 48, 52, 46, 62, 54, 40, 96, 52, 98, 40, 42, 52, 60
Find the mean, median and mode of this data.
Solution:
To find the mean:
Here, n = 15
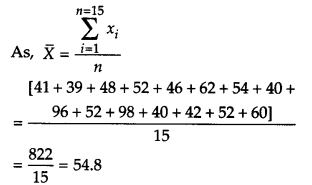
Thus, mean = 54.8
To find median:
Arranging the given data in ascending order,
we have
39, 40, 40, 41, 42, 46, 48, 52, 52, 52, 54, 60, 62, 96,98
∵ n = 15, an odd number
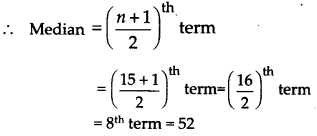
Thus, median = 52
To find mode:
In the given data, the observation 52 occurs 3 times,
i.e., the maximum number of times.
Thus, mode = 52
Ex 14.4 Class 9 Maths Question 3.
The following observations have been arranged in ascending order. If the median of the data is 63, find the value of x.
29, 32, 48, 50, x, x + 2, 72, 78, 84, 95
Solution:
Here, the given observations are in ascending order.
Since, n = 10 (an even number)
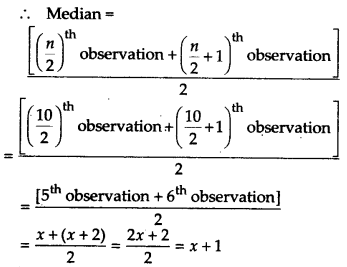
Since, median = 63 [Given]
∵ x + 1 = 63 ⇒ x = 63 – 1 = 62
Thus, the required value of x is 62.
Ex 14.4 Class 9 Maths Question 4.
Find the mode of 14, 25,14, 28,18,17,18,14, 23, 22,14 and 18.
Solution:
Arranging the given data in ascending order, we have 14, 14, 14, 14, 17, 18, 18, 18, 22, 23 25, 28.
Since the observation 14 is occuring the maximum number of times (i.e. 4 times)
∴ Mode of the given data = 14
Ex 14.4 Class 9 Maths Question 5.
Find the mean salary of 60 workers of a factory from the following table
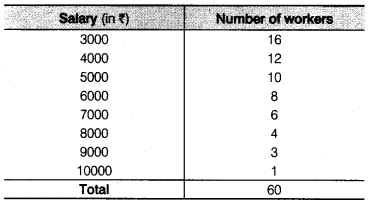
Solution:
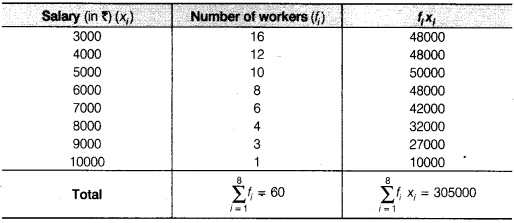
Thus, the required mean salary = Rs. 5083.33
Ex 14.4 Class 9 Maths Question 6.
Give one example of a situation in which
(i) the mean is an appropriate measure of central tendency.
(ii) the mean is not an appropriate measure of central tendency but the median is an appropriate measure of central tendency.
Solution:
(i) Mean height of the students of a class.
(ii) Median weight of a pen, a book, a rubber band, a match box and a chair.
NCERT Solutions for Class 9 Maths
- Chapter 1 Number systems
- Chapter 2 Polynomials
- Chapter 3 Coordinate Geometry
- Chapter 4 Linear Equations in Two Variables
- Chapter 5 Introduction to Euclid Geometry
- Chapter 6 Lines and Angles
- Chapter 7 Triangles
- Chapter 8 Quadrilaterals
- Chapter 9 Areas of Parallelograms and Triangles
- Chapter 10 Circles
- Chapter 11 Constructions
- Chapter 12 Heron’s Formula
- Chapter 13 Surface Areas and Volumes
- Chapter 14 Statistics
- Chapter 15 Probability
- Class 9 Maths (Download PDF)