We have given these Accountancy Class 12 Important Questions and Answers Chapter 9 Analysis of Financial Statements to solve different types of questions in the exam. Go through these Class 12 Accountancy Chapter 9 Analysis of Financial Statements Class 12 Important Questions and Answers Solutions & Previous Year Questions to score good marks in the board examination.
Analysis of Financial Statements Important Questions Class 12 Accountancy Chapter 9
Question 1.
State any two limitations of financial statement analysis. (compartment 2018: Delhi (C) 2015)
Or
State any one limitation of financial statement analysis. (Delhi 2014.2013,2010; Delhi (C) 2014, All India 2014.2014 (C). 2013,2010)
Answer:
Limitations of financial statement analysis are
- Financial statement analysis ignore qualitative aspects like quality of management, labour force and public relations.
- The results obtained by analysis of financial statements may be misleading due to window dressing.
![]()
Question 2.
What is meant by analysis of financial statements? Delhi (Cl 2015; All India 2011)
Answer:
The process of critical evaluation of the financial information contained in the financial statements, in order to understand and make decisions regarding the operations of the Arm, is called financial statement analysis.
Question 3.
State any two objectives of financial statement analysis. (All India Delhi 2018)
Or
State any one objective of financial statement analysis. (All India 2014,2013: Delhi 2013.2010 Delhi (C) 2014)
Answer:
Objectives of financial statement analysis are
- To judge the operating efficiency and profitability of the business.
- To measure the short-term and long-term financial position of the enterprise.
Question 4.
State one advantage of financial statement analysis. (Delhi 2013)
Answer:
Financial statement analysis helps the management to judge the overall as well as segmentwise operational efficiency of the business.
Question 5.
Explain how financial statement analysis ignores qualitative elements? (All India.2013)
Or
State how qualitative aspects are ignored in financial statement analysis? (Delhi (C) 2011)
Answer:
Financial statement analysis ignore qualitative elements as it is confined to the monetary matters only because quality cannot be measured in monetary terms.
Question 6.
State the significance of analysis of financial statements to ‘top management’. (All India 2012)
Answer:
Financial statement analysis enables the ‘top management’ to evaluate the overall efficiency of the business. It provides adequate information for planning, budgeting and controlling the affairs of the business in future.
Question 7.
State the significance of analysis of financial statements to ‘lenders’. (Delhi 2012)
Answer:
Lenders can judge the long-term and short-term solvency of the business or its ability to repay debts and interest through analysis of financial statements which will help them to decide whether they should lend or not.
Question 8.
How is the financial statement analysis useful to finance manager? (All India 2011)
Answer:
Financial statement analysis is useful to finance manager for taking financial decisions for the business. It provides adequate information for financial planning.
Question 9.
State the interest of tax authorities in the analysis of financial statements. (All India 2011)
Answer:
Tax authorities are interested to analyse the financial statements to know about the revenue of business firm and to ensure proper assessment of liabilities of the business as per the laws in force, from time to time.
Question 10.
State the interest of investors in the analysis of financial statements. (All India 2011)
Answer:
Investors are interested in knowing the earning capacity of the business and its prospects for future growth and returns through analysis of financial statements, so that they can decide whether they should invest or not.
Question 11.
How does subjectivity become a limitation of financial statement analysis? (Delhi 2010)
Answer:
Subjectivity becomes a limitation of financial statement analysis because an analyst has to exercise his own judgement and bias in the process of drawing conclusions.
Question 12.
How is ‘window dressing a limitation of financial statement analysis? (All India 2010)
Answer:
‘Window dressing’ refers to displaying the rosy picture of an enterprise through financial statements. Sometimes, material information is concealed in financial statements due to ‘window dressing’.
Question 13.
One of the objectives of ‘financial statement analysis’ is to identify the reasons for change in the financial position of the enterprise. State two more objectives of this analysis. (Delhi, All India 2016)
Or
One of the objectives of ‘financial statement analysis’ is to judge the ability of the firm to repay its debt and assessing the short-term as well as the long-term liquidity position of the firm. State two more objectives of this analysis. (Delhi; All India 2016)
Or
One of the objectives of ‘financial statement analysis’ is to ascertain the relative importance of the different components of the financial position of the firm. State two more objectives of this analysis. (Delhi; All India 2016)
Answer:
The two more objectives of this analysis are
- To compare the intra-firm position, inter-firm position and pattern position within the industry.
- To measure the operating efficiency and profitability of the enterprise.
![]()
Question 14.
Explain briefly any four objectives of ‘Analysis of financial statements’. (Delhi 2019)
Or
State the objectives of ‘analysis of financial statements’. (Delhi: All India 2017)
Answer:
The objectives of analysis of financial statements are as follows
- To judge the financial stability of an enterprise.
- To measure the short-term and long-term solvency of enterprise.
- To measure the operating efficiency and profitability of an enterprise.
- To compare the intra-firm position, inter-firm position and pattern position within the industry.
Question 15.
Explain the importance of financial analysis of (i) labour unions and (ii) creditors. (All India 2019)
Answer:
(i) Labour unions They analyse the financial statement to assess whether the business concern is earning a fair rate of return on capital employed and whether they should demand for increased wages or not. So, financial statement analysis helps the labour unions in settling wage agreements.
:
Question 16.
Explain briefly any four limitatioixs of ‘analysis of financial statements’. (All India 2019, 2017: Delhi 2017)
Answer:
The limitations of analysis of financial statements are as follows
- It ignores price level changes.
- It is not free from bias.
- It suffers from limitations of financial statements.
- It ignores qualitative aspects.
Question 17.
What is meant by ‘analysis of financial statements’? State any two objectives of such an analysis. (All India 2017)
Answer:
The process of critical evaluation of the financial information contained in the financial statements, in order to understand and make decisions regarding the operations of the firm is called financial statement analysis.
The objectives of such analysis are as follows
- To judge the financial stability of an enterprise.
- To measure the short-term and long-term solvency of the enterprise.
Question 18.
Which item is assumed to be 100 while preparing common size statement of profit and loss? (All India (C) 2014)
Answer:
Revenue from operations are assumed to be 100 while preparing common size statement of profit and loss.
Question 19.
Name any two tools of analysis of financial statements. (All India 2014)
Answer:
Two tools of analysis of financial statements are
- Comparative financial statements
- Common size statements
Question 20.
What is meant by a common size statements? (Delhi 2011)
Answer:
The statement wherein figures reported are converted into percentage to some common base are known are common size statements. Each percentage shows the relation of the individual item to its respective total. In common size income statement, revenue from operations (net sales) figure is assumed to be 100 and all other figures of expenses and other incomes are expressed as a percentage of sales. In common size balance sheet, the total of assets or liabilities is assumed to be 100 and figures are expressed as a percentage of the total.
Question 21.
How the earning capacity of a business is assessed by financial statement analysis? (Delhi 2010)
Answer:
The earning capacity of a business is assessed by financial statement analysis through profitability ratios.
Question 22.
How the solvency of a business is assessed by financial statement analysis? (Delhi 2010)
Answer:
The solvency of a business is assessed by financial statement analysis through long-term and short-term solvency ratios.
Question 23.
From the following information, prepare a comparative statement of profit and loss for the year 2009-2010
| Particulars | Amt (₹) | Amt (₹) |
| Revenue from Operations | 7,00,000 | 8,50,000 |
| Materials Consumed | 3,30,000 | 4,20,000 |
| Manufacturing and Office Expenses | 2,40,000 | 2,60,000 |
| Other Incomes | 30,000 | 30,000 |
Other Information
(i) Income tax is calculated @ 50%.
(ii) Manufacturing expenses are 50% of the total of that category. (All India (C) 2011 Modified)
Answer:
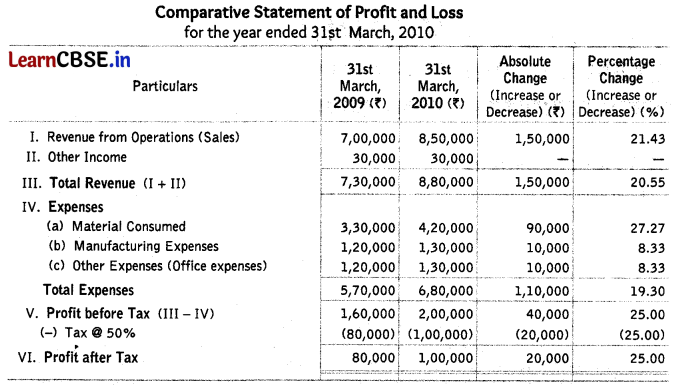
Working note:
Manufacturing expenses = 50% of manufacturing and office expenses
2009 ⇒ \(\frac { 50 }{ 100 }\) × 2,40,000 = ₹ 1,20,000 ; 2010 ⇒ \(\frac { 50 }{ 100 }\) × 2,60,000 = ₹ 1,30,000
![]()
Question 24.
From the information extracted from the Statement of Profit and Loss for the years ended 31st March, 2017 and 31st March, 2018, prepare a Comparative Statement of Profit and Loss: (All India 2019)
| Particulars | 2017-18 | 2016-17 |
| Revenue from operations | 300% of cost of material consumed | 200% of cost of material consumed |
| Cost of materials consumed | ₹ 2,40,000 | ₹ 2,00,000 |
| Other expenses | 20% of cost of material consumed | 10% of cost of material consumed |
| Tax rate | 50% | 50% |
Answer:
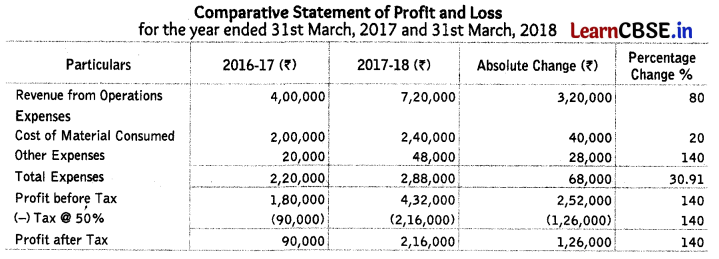
Question 25.
From the following information prepare a Comparative Income Statement of NY Ltd :
| Particulars | 2016-17 (₹) | 2017-18 (₹) |
| Revenue from operations | 15,00,000 | 24,00,000 |
| Cost of materials consumed | 8,00,000 | 12,00,000 |
| Employee benefit expenses | 1,20,000 | 1,80,000 |
| Other expenses | 80,000 | 60,000 |
Answer:
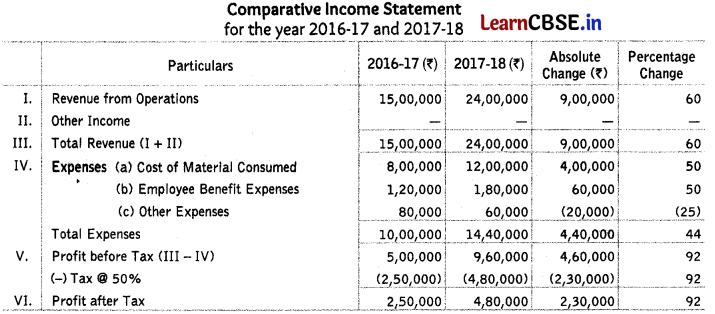
Question 26.
Prepare a comparative income statement of Bikul ltd. with the help of the following Information:
| Particulars | March 31 st 2015 Amt (₹) | March 31 st 2014 Amt (₹) |
| Revenue from operations | 10,00,000 | 16,00,000 |
| Cost of materials consumed | 5,00,000 | 10,00,000 |
| Employee benefit expenses | 80,000 | 40,000 |
| Other Indirect expenses | 60,000 | 80,000 |
Tax rate 50%. (All India 2019)
Answer:
Solve as Q. No. 8 on page 411
Profit after Tax
2016-17 – ₹ 2,16,000
2017-18 – ₹ 2,88,000
Absolute change – ₹ 72,000 (33.33%)
Question 27.
From the following information extracted from the Statement of Profit and Loss for the years ended 31st March, 2017 and 2018, prepare a Comparative Statement of Profit & Loss.
| Particulars | 2017-18 (₹) | 2016-17 (₹) |
| Revenue from operations | 6,00,000 | 5,00,000 |
| Other Income (%) | 20% | 20% |
| Employee benefit expenses (%) | 40% | 30% |
| Tax Rate | 50% | 50% |
Answer:
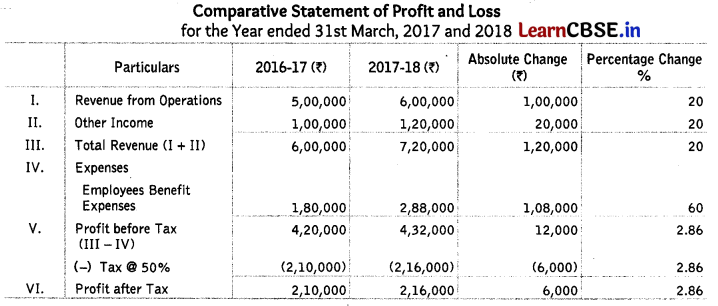
Question 28.
Prepare a comparative statement of Profit and Loss from the following information extracted from the statement of Profit and Loss for the year ended 31st March, 2017 and 2018.
| Particulars | 2017-18 (₹) | 2017-18 (₹) |
| Revenue from operations | 12,00,000 | 10,00,000 |
| Other Income (%) | 25% | 25% |
| Employee benefit expenses (%) | 40% | 30% |
| Tax Rate | 40% | 40% |
Answer:
Solve as Q. No. 10 on page 411 and 412.
Profit after Tax
2016 – 17 – ₹ 5,25,000
2017 – 18 – ₹ 5,40,000
Absolute change – ₹ 15,000 (2.86%)
Question 29.
Prepare a comparative statement of Profit and Loss from the information extracted from the statement of Profit and Loss for the year ended 31st March, 2017 and 2018.
| Particulars | 2017-18 | 2016-17 |
| Revenue from operations | 15,00,000 | 10,00,000 |
| Other Income (%) | 60% | 50% |
| Employee benefit expenses (%) | 40% | 30% |
| Tax Rate | 40% | 40% |
Answer:
Solve as Q. No. 10 on page 411 and 412.
Profit after Tax
2016- 17 – ₹ 6,30,000
2017- 18 – ₹ 8,64,000
Absolute change – ₹ 2,34,000 (37.14%)
![]()
Question 30.
From the following Balance Sheet of KP Ltd. as at 31st March, 2018, prepare a Common Size Balance Sheet:
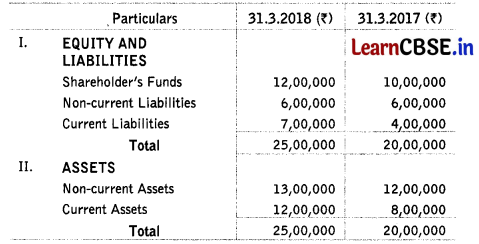
Answer:
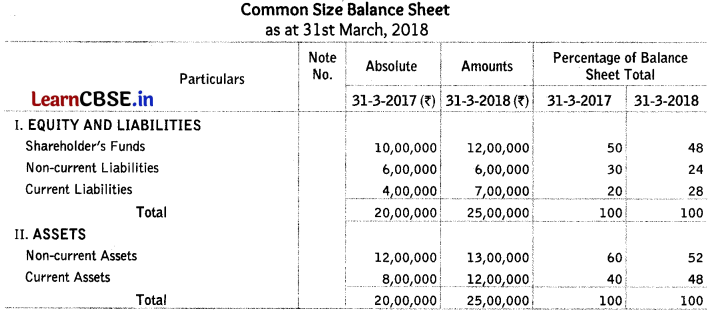
Question 31.
Prepare a common size balance sheet of KJ Ltd from the following information:
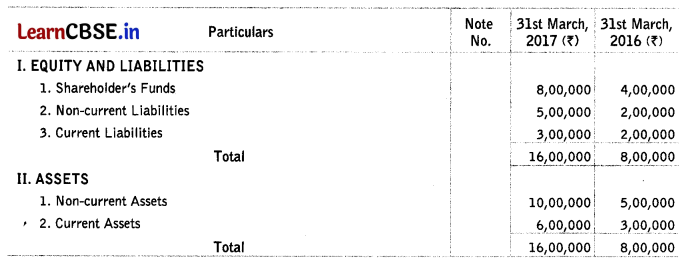
Answer:
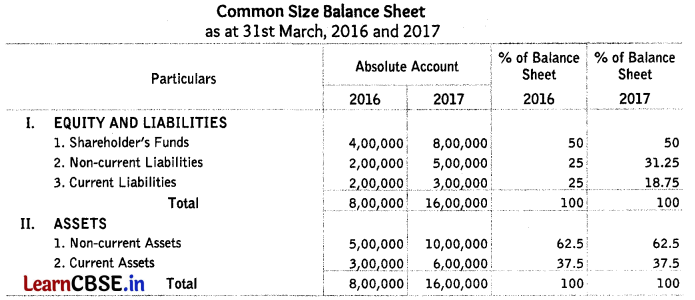
Question 32.
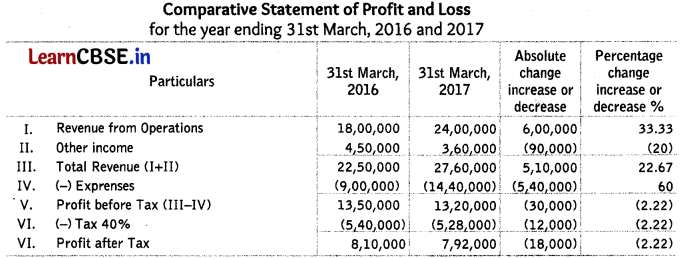
Firm the following information, prepare a Comparative Statement of Profit and Loss:
| Particulars | 2017-18 | 2016-17 |
| Revenue from operations | 24,00,000 | 18,00,000 |
| Other Income (%) | 15% | 25% |
| Expenses (%) | 60% | 50% |
| Tax Rate | 40% | 40% |
Answer:
Question 33.
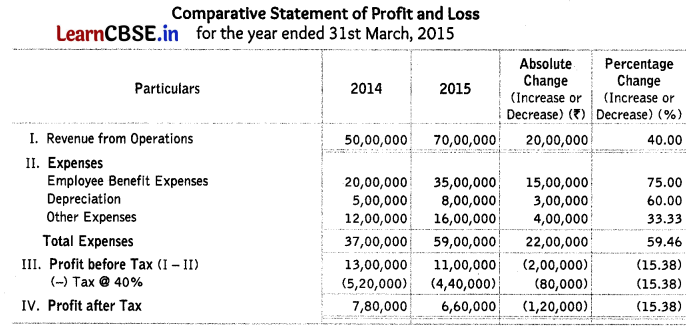
Prepare a comparative statement of profit and loss from the following information extracted from the statement of profit and loss of Fun Sports Ltd for the year ended 31st March, 2015.
| Particulars | March 31 st 2015 Amt (₹) | March 31 st 2014 Amt (₹) |
| Revenue from operations | 70,00,000 | 50,00,000 |
| Employee benefit expenses | 35,00,000 | 20,00,000 |
| Depreciation | 8,00,000 | 5,00,000 |
| Other Expenses | 16,00,000 | 12,00,000 |
| Tax Rate | 40% | 40% |
Answer:
Question 34.
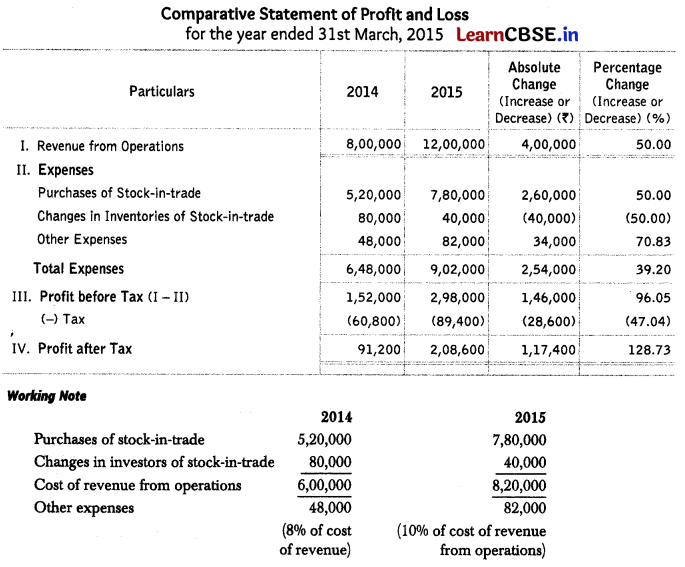
Prepare comparative statement of profit and loss from the following information
| Particulars | March 31 st 2015 Amt (₹) | March 31 st 2014 Amt (₹) |
| Revenue from operations | 12,00,000 | 8,00,000 |
| Purchase of stock in trade | 7,80,000 | 5,20,000 |
| Change in Inventories of stock in trade | 40,000 | 80,000 |
| Other Expenses | 10% of cost revenue from operations | 8% of cost revenue from operations |
| Tax Rate | 30% | 40% |
Answer:
Question 35.
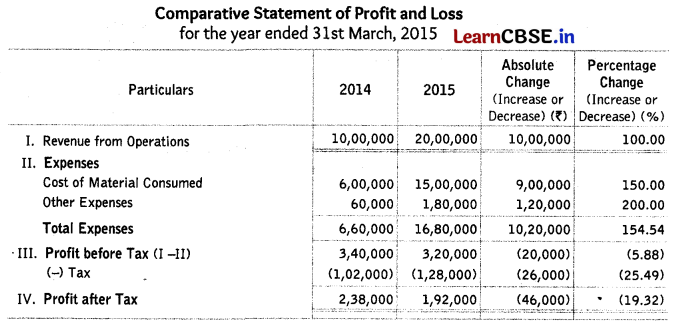
From the following information prepare a comparative statement of profit and loss of V Ltd for the year ended 31st March, 2015.
| Particulars | March 31 st 2015 Amt (₹) | March 31 st 2014 Amt (₹) |
| Revenue from operations | 20,00,000 | 10,00,000 |
| Cost of materials consumed | 15,00,000 | 6,00,000 |
| Other Expenses | 12% of cost revenue from operations | 10% of cost revenue from operations |
| Tax Rate | 40% | 30% |
Prepare comparative statement of profit and loss. (Delhi (C) 2016)
Answer:
Question 36.
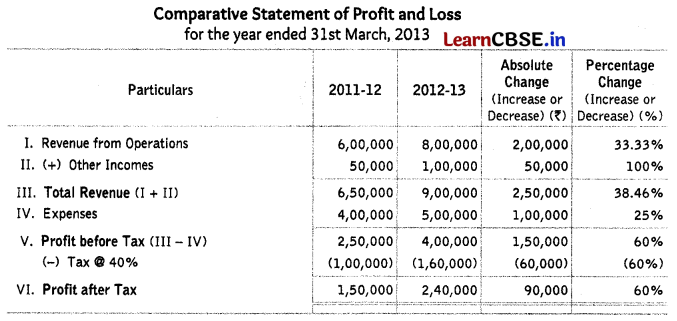
From the following statement of profit and loss of Fenox Ltd for the year ended 31st March, 2013, prepare a comparative statement of profit and loss.
| Particulars | Note No. | 2012 – 2013 Amt (₹) | 2011 – 2012 Amt (₹) |
| Revenue from operations | 8,00,000 | 6,00,000 | |
| Other Incomes | 1,00,000 | 50,000 | |
| Expenses | 5,00,000 | 4,00,000 |
Rate of income tax was 40%. (All India 2014)
Answer:
Question 37.
From the following ‘statement of profit and loss for the year ended 31st March, 2013, preparp a comparative statement of profit and loss of Good Services Ltd. (Delhi 2014)
| Particulars | Note No. | 2012 – 2013 Amt (₹) | 2011 – 2012 Amt (₹) |
| Revenue from operations | 20,00,000 | 15,00,000 | |
| Other Incomes | 10,00,000 | 4,00,000 | |
| Expenses | 21,00,000 | 15,00,000 |
Rate of income tax was 50%.
Answer:
Solve as Q. No. 19 on page 416 and 417.
Net Profit after Tax; 2011-12 = ₹ 2,00,000; 2012-13 = ₹ 4,50,000; Absolute Change = ₹ 2,50,000;
Percentage Change = 125%
Question 38.
From the following ‘statement of profit and loss’ of Suntrack Ltd. for the years ended 31st March, 2011 and 2012, prepare a ‘comparative statement of profit and loss’.
| Particulars | Note No. | 2012 – 2013 Amt (₹) | 2011 – 2012 Amt (₹) |
| Revenue from operations | 20,00,000 | 12,00,000 | |
| Other Incomes | 12,00,000 | 9,00,000 | |
| Expenses | 13,00,000 | 10,00,000 |
Answer:
Solve as Q. No. 19 on page 416 and 417.
Profit before Tax; 2010-11 = ₹ 11,00,000; 2011-12 = ₹ 19,00,000; Absolute Change = ₹ 8,00,000
Percentage Change = 72.73%
![]()
Question 39.
From the following ‘statement of profit and loss’ of Moontrack Ltd. for the years ended 31st March, 2011 and 2012, prepare a ‘comparative statement of profit and loss.’
| Particulars | Note No. | 2012 – 2013 Amt (₹) | 2011 – 2012 Amt (₹) |
| Revenue from operations | 40,00,000 | 24,00,000 | |
| Other Incomes | 24,00,000 | 18,00,000 | |
| Expenses | 16,00,000 | 14,00,000 |
Answer:
Solve as Q. No. 19 on page 416 and 417.
Profit before Tax 2010-11 = ₹ 28,00,000; 2011-12 = ₹ 48,00,000; Absolute Change = ₹ 20,00,000;
Percentage Change = 71.43%
Question 40.
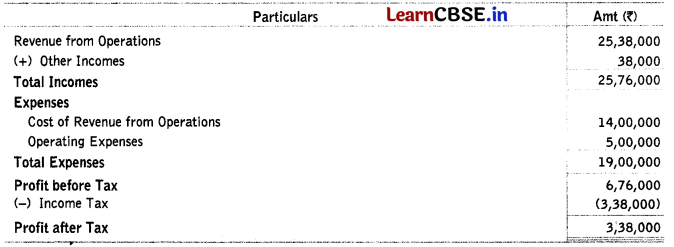
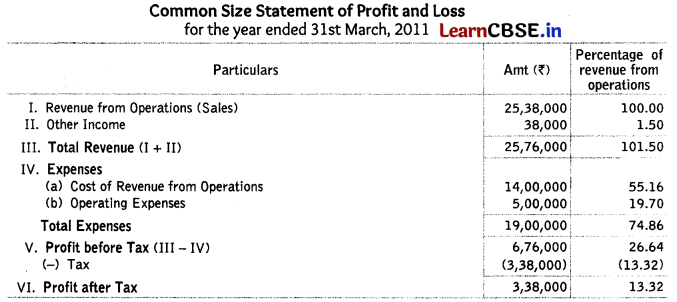
From the following income statement, prepare a common size statement of profit and loss
Answer:
Question 41.
Following is the statement of profit and loss of Raj Ltd for the year ended 31st March, 2011.
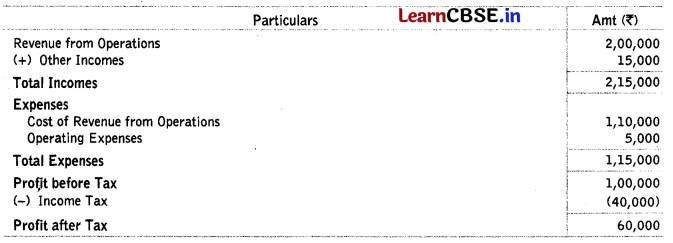
Prepare a common size statement of profit and loss of Raj Ltd for the year ended 31st March, 2011. (Delhi 2012: Modified)
Answer:
Solve as Q. No. 23 on page 418.
Percentage of Revenue from Operations = 30%
Question 42.
Prepare a comparative statement of profit and loss from the following information.
| Particulars | March 31 st 2009 Amt (₹) | March 31 st 2010 Amt (₹) |
| Revenue from Operations | 40,000 | 50,000 |
| Cost of Revenue from Operations | 30,000 | 35,000 |
| Wages Paid | 16,000 | 14,000 |
| Operating Expenses | 2,500 | 3,000 |
| Other Incomes | 2,000 | 3,000 |
| Income Tax | 4,750 | 7,500 |
Answer:
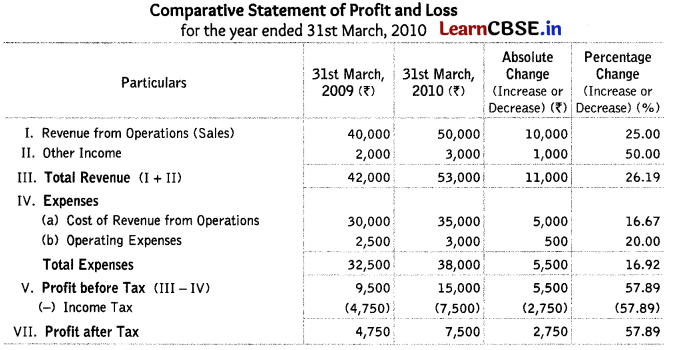
NOTE Wages paid are a part of direct expenses and they are already included in cost of goods sold.
Question 43.
Prepare a comparative statement of profit and loss from the following information
| Particulars | 2009 Amt (₹) | 2010 Amt (₹) |
| Revenue from Operations | 10,00,000 | 12,50,000 |
| Cost of Revenue from Operations | 5,00,000 | 6,50,000 |
| Carriage Inwards | 30,000 | 50,000 |
| Operating Expenses | 50,000 | 60,000 |
| Income Tax | 50% | 50% |
Answer:
Solve as Q no. 25 on page 419.
Profit after Tax : 2009 = ₹ 2,25,000; 2010 = ₹ 2,70,000; Absolute Value = ₹ 45,000 ; Percentage Change = 20%
HINT: Carriage inwards are a part of direct expenses and they are already included in cost of goods sold.
Question 44.
From the following information given below, prepare a comparative statement of profit and loss.
| Particulars | March 31 st 2008 Amt (₹) | March 31 st 2009 Amt (₹) |
| Revenue from Operations | 2,00,000 | 3,50,000 |
| Purchase | 1,00,000 | 2,00,000 |
| Cost of Revenue from Operations | 60% Revenue from operations | 70% Revenue from operations |
| Administrative Expenses | 5% on Gross Profit | 7% on Gross Profit |
| Income Tax | 45% | 45% |
Answer:
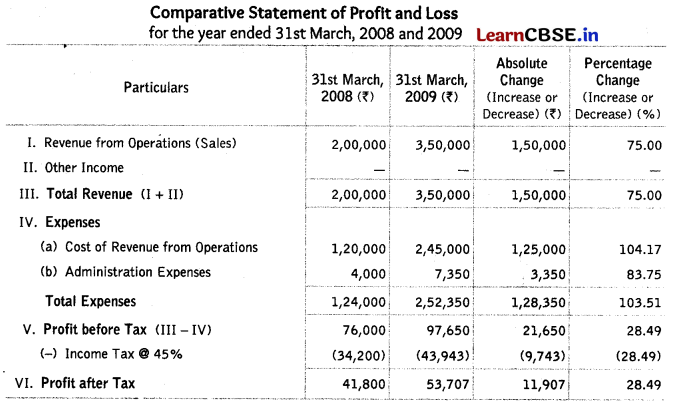
NOTE Purchase is a part of cost of goods sold and thus not shown separately.
Working Notes:

Question 45.
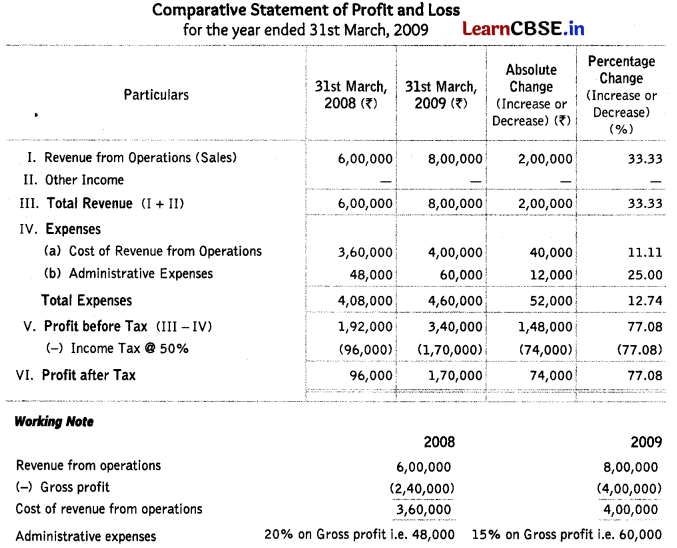
From the following information provided, prepare a comparative statement for the period 2008 and 2009.
| Particulars | March 31 st 2008 Amt (₹) | March 31 st 2009 Amt (₹) |
| Revenue from Operations | 6,00,000 | 8,00,000 |
| Gross Profit | 40% Revenue from operations | 50% Revenue from operations |
| Administrative Expenses | 20% on Gross Profit | 15% on Gross Profit |
| Income Tax | 50% | 50% |
Answer:
Question 46.
When financial statements for a single year are analysed, it is called
(a) vertical analysis
(b) horizontal analysis
(c) lateral analysis
(d) circular analysis
Answer:
(a) vertical analysis
![]()
Question 47.
Sumatra limited wants to assess the future profit earning capacity of its business. It will conduct
(a) external analysis
(b) short-term analysis
(c) long-term analysis
(d) None of these
Answer:
(c) long-term analysis
Question 48.
Tools of analysis and interpretation of financial statement are
(a) comparative balance sheet and income statement
(b) common size trial balance
(c) trend ratio
(d) ratios, comparative balance sheet and common size statements
Answer:
(d) ratios, comparative balance sheet and common size statements
Question 49.
Comparative statement is a analysis.
(a) horizontal
(b) vertical
(c) diagonal
(d) None of these
Answer:
(a) horizontal
Question 50.
Comparative balance sheet consists of ………. columns.
(a) five
(b) three
(c) six
(d) four
Answer:
(a) five
Question 51.
In common size statement of profit and loss, amount corresponding to is assumed to be equal to 100.
(a) net profit
(b) revenue from operations
(c) cost of revenue from operations
(d) All of the above
Answer:
(b) revenue from operations
Question 52.
express all items of an financial statements as a percentage of some common base.
(a) Common size statements
(b) Comparative statements
(c) Trend analysis
(d) Cash flow statement
Answer:
(a) Common size statements
Question 53.
Fixed assets of a company increased from ₹ 3,00,000 to ₹ 4,00,000. What is the percentage change?
(a) 25%
(b) 33.3%
(c) 20%
(d) 50%
Answer:
(b) 33.3%
Question 54.
A company’s revenue from operations is 20,00,000, cost of revenue from operations is ₹ 14,00,000 and indirect expenses are ₹ 2,00,000, then what is the amount of gross profit?
(a) ₹ 6,00,000
(b) ₹ 3,00,000
(c) ₹ 5,00,000
(d) ₹ 16,00,000
Answer:
(a) ₹ 6,00,000
Question 55.
Total of equity and liabilities is ₹ 15,00,000 and share capital is ₹ 3,00,000 as on 31st March, 2017. What will be the percentage of share capital shown in the common size balance sheet?
(a) 18%
(b) 20%
(c) 15%
(d) 25%
Answer:
(b) 20%
![]()
Question 56.
Calculate amount of tax to be deducted.
Revenue from Operations – ₹ 5,00,000
Other income (% of Revenue from Operations) – 20%
Expenses (% of Operating Revenue) – 40%
Tax Rate – 30%
(a) ₹ 1,50,000
(b) ₹ 1,20,000
(c) ₹ 1,00,000
(d) ₹ 2,00,000
Answer:
(b) ₹ 1,20,000
Question 57.
If net revenue from operations is ₹ 1,20,000, cost of revenue from operations is ₹ 40,000 and operating expenses are ₹ 20,000, what will be the percentage of operating income on net revenue from operations?
(a) 45%
(b) 55%
(c) 50%
(d) 65%
Answer:
(c) 50%