CBSE Previous Year Question Papers Class 12 Economics 2011 Outside Delhi
Time allowed : 3 hours
Maximum marks: 100
CBSE Previous Year Question Papers Class 12 Economics 2011 Outside Delhi Set – I
Section – A
Question 1.
What is a planned economy? [1]
Answer:
An economic system in which economic decisions are made by the state or government rather than by the interaction between consumers and business. Unlike a market economy in which production decisions are made by private citizens and business owners, a centrally planned economy seeks to control what is produced and how resources are distributed and used.
Question 2.
When a firm is called price maker? [1]
Answer:
A firm is said to be a price maker when it has the total freedom to fix the price level at which it maximizes its profit.
Question 3.
Define a budget iine. [1]
Answer:
A graphical depiction of the various combinations of two selected products that a consumer can afford at specified prices for the products given their particular income level. When a typical business is analyzing a two product budget line, the amounts of the first product are plotted on the horizontal X axis and the amounts of the second product are plotted on the vertical Y axis. Algebraically, a budget line is represented as follows.
P
1
x
1
+ P
2
x
2
= M
Where,
P
1
x
1
represents the amount spent on good 1
P
2
x
2
represents the amount spent on good 2
M represents the income of the consumer.
Question 4.
What is ‘decrease’ in supply? [1]
Answer:
When a negative change in any of the determinants of supply, except the price of the commodity, leads to the reduction in the supply of the commodity, it is called decrease in supply. Decrease in supply is depicted by leftward shift in the supply curve.
Question 5.
Define production function. [1]
Answer:
The technical and technological relationship between inputs and output is known as production function. In other words, the physical relationship between inputs and outputs under given technology is called production function.
Algebraically, a production function can be represented as:
Q
x
= f(L, K)
Where,
L represents units of labour used (input one)
K represents units of capital used (input two)
Q
x
represents emits of output x produced (output)
Question 6.
How is production possibility curve affected by unemployment in the economy? Explain. [3]
Answer:
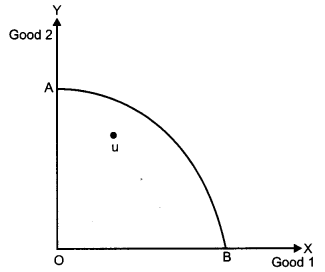
The number of people of working age without a job is usually expressed as an unemployment rate, a percentage of the workforce. Due to the presence of unemployment, the PPC of an economy would be affected adversely. This is because PPC depicts the amount of two goods that an economy can produce employing all its resources. Due to unemployment the economy will not operate on its full potential, and economy will operate on less efficient PPC. In the figure below, AB represents the PPC of an economy which is associated with the full employment of the resources. However, due to the presence of unemployment, the economy is operating at point U which is below the PPC. The point U depicts that the economy is operating below its full potential or efficiency level.
Question 7.
When price of a good is ₹ 13 per unit, the consumer buys 11 units of that good. When price rises to ₹ 15 per unit, the consumer continues to buy 11 units. Calculate price elasticity of demand. [3]
Answer:
Given,
| p | Q |
| 13 | 11 |
| 15 | 11 |
ΔP = (15 – 13) = 2 and,
ΔQ = (11 – 11) = 0
Now,
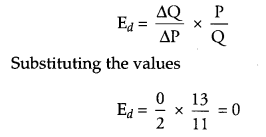
Hence, Demand is Perfectly Inelastic.
Question 8.
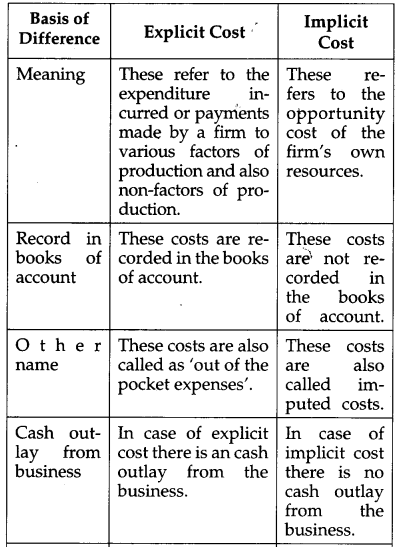
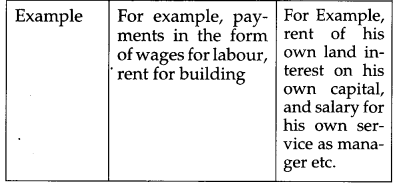
Distinguish between explicit cost and implicit cost and give examples. ‘ [3]
Answer:
Question 9.
Draw in a single diagram the average revenue and marginal revenue curves of a firm which can sell any quantity of the good at a given price. Explain. [4]
Answer:
It is under perfect competition, where a firm can sell any quantity of a good at a given price. The average revenue and marginal revenue curve for a perfectly competitive firm are drawn as follows :
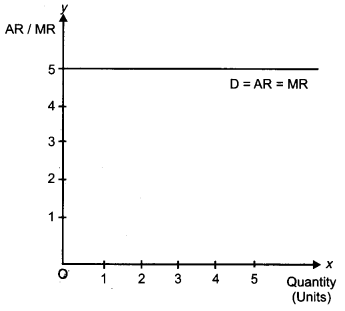
Under perfect competition, the AR curve and the MR curve coincide with each other. The AR curve is also known as the price line or the demand curve. Thus, it can be said that the demand, AR and the AR curves all are equal to each other. They are drawn as a horizontal straight line, which is parallel to the output-axis. This represents that the price and MR remain constant at all levels of output.
Question 10.
Explain the implications of the feature Targe number of buyers’ in a perfectly competitive market. [4]
OR
Explain the implications of the feature ‘homogeneous products’ in a perfectly competitive market.
Answer:
The implication of large number of buyers in a perfectly competitive market is that no individual buyer can affect the market price for a commodity. In a perfect competetive market the number of buyers is so large and each individual buyer purchases only a small portion of the total output. As a result, no single buyer can influence the prevailing market price. He can only decide the quantities of the commodity to purchase and cannot influence the existing price.
OR
The implication of the existence of homogeneous products in a perfectly competitive market is that there exists uniform price in the market. The output of all the sellers in the market are similar and identical to each other in terms of quantity, quality, colour, size, features, etc. This indicates that the buyers are indifferent between the products of the different firms. In such a situation, if any single firm attempts to change a price that is slightly higher than the market price, then all its consumers will shift their price towards the products of other firms and the firm that raised the price will lose its consumers. Thus, the existence of homogeneous products enforces the uniformity of price, charged by different firms.
Question 11.
A consumer consumes only two goods X and Y. At a consumption level of these two goods, he finds that the ratio of marginal utility to price in case of X is higher than in case of Y. Explain the reaction of the consumer. [4]
Answer:
A consumer consuming only two commodities X and Y attains equilibrium at the level where,
Marginal Utility of a Rupee spent on commodity
X = Marginal Utility of a Rupee spent on commodity Y = Marginal Utility of Money.
or, \(\frac{M U_{x}}{P_{x}}=\frac{M U_{y}}{P_{y}}=M U_{m}\)
However, when the utility to price of X of Y, that is, if \(\left(\frac{M U_{x}}{P_{x}}>\frac{M U_{y}}{P_{y}}\right)\) then, the consumer rearranges his consumption combination such that the equality is again restored. He would increase his consumption of commodity X. With the increase in the consumption of commodity X, marginal utility of X falls. As a result, the ratio of marginal utility to price of X falls. The consumer would continue increasing the consumption of commodity X till the equality between the ratio of marginal utility to price in case of X and Y is again reached. That is, in other words, when he reaches point E, where the equilibrium is restored by the equality between the marginal utilities of each commodities.
Question 12.
Explain how rise in income of a consumer affects the demand of a good. Give examples. [6]
Answer:
The effect of increase in income of a consumer on the demand of a good depends on the type of the good.
Normal Goods: The demand for normal goods share a positive relationship with a consumer’s income. That is, as income of the consumer increases, the demand for normal goods also increases. For example, shirt is a normal good. As the income of the consumer increases, the demand for shirts increases.
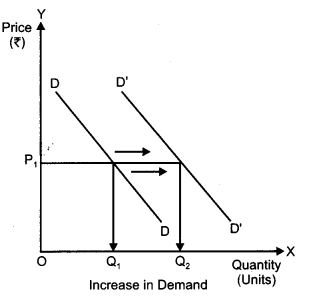
In the figure, initially at the price OP
1
, consumer is consuming OQ
1
units of good. With an increase in the income of the consumer, the demand for the good increases and the demand curve shifts parallel outwards to D’D’. The consumer purchases more units of the good (OQ
2
) at the same price OP
1
.
Inferior Goods and Giffen Goods: The demand for the inferior goods and the giffen goods share a negative relationship with a consumer’s income. That is, as the income increases, the demand for these goods falls. ,
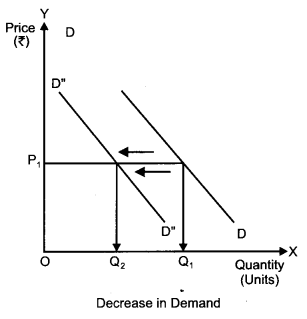
In the figure, initially at the price OP
1
, consumer is consuming OQ
1
units of good. With an increase in the income of the consumer, the demand for the inferior good (or Giffen good) falls and the demand curve shifts parallel inwards to D”D”. The consumer purchases lesser units of the good (OQ
2
) at the same price OP
1
£
Question 13.
Define marginal cost. Explain its relation with average cost. [6]
OR
Define variable cost. Explain the behaviour of total variable cost as output increases.
Answer:
Marginal cost is defined as the additional cost to the Total Cost, which is incurred for producing one additional unit of output. Algebraically,
MC
n
= TC
n
– TC
n-1
Average Cost is defined as per unit cost of • producing output. It is derived by dividing total cost by quantity of output produced. That is,
AC = \(\frac{T C}{Q}\)
With the increase in output, both AC and MC fall. However, MC falls faster than AC and the MC curve remains below the AC curve. MC reaches its minimum point faster than AC and starts rising. When MC starts rising AC is still falling. MC curve cuts the AC curve at its minimum. When AC starts rising, it rises at a slower rate and AC curve remains below MC curve.
Relationship between AC and MC is explained with the help of the following diagram.
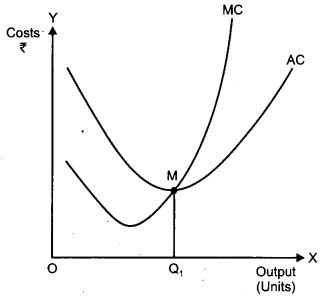
Relationship between AC and MC:
When AC is falling, MC falls at a faster rate; and MC remains below AC curve.
When AC is rising, MC rises at a faster rate; and MC remains above AC curve.
When AC is at its minimum point, MC is equal to AC.
MC curve cuts AC curve at its minimum point.
OR
Variable costs refer to the costs which are incurred by a firm on the variable inputs for production.
The variable costs are positive function of output i.e., as output increases, variable costs also increases and vice-versa. That is, as more and more units of variable factor (such as labour) are employed to produce higher units of output, the variable costs rises. Initially, with the increase in output, total variable cost increases at a diminishing rate. With further increase in output, the total variable cost starts increasing at an increasing rate.
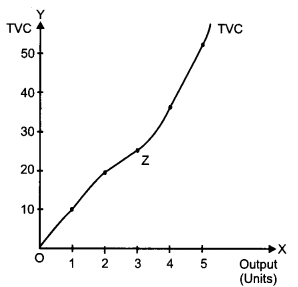
In the figure above, output is shown on X-axis and total variable cost (TVC) on the Y-axis. With the increase in output, total variable cost increases at a diminishing rate till point Z. Beyond point Z, with further increase in output, the total variable cost increase with increasing rate.
Question 14.
What is producer’s equilibrium? Explain the conditions of producer’s equilibrium through the ‘marginal cost and marginal revenue’ approach. Use diagram. [6]
Answer:
According to MR-MC approach, a producer/firm attains equilibrium where the following two conditions are satisfied.
(i) Necessary Condition or First Order Condition (FOC)
MR = MC
or, \(\frac{\mathrm{d}(\mathrm{TR})}{\mathrm{dx}}=\frac{\mathrm{d}(\mathrm{TC})}{\mathrm{dx}}\)
(ii) Sufficient Condition or Second Order Condition (SOC)
MC curve is rising and cuts MR curve from below
That is, Slope of MC > 0
∴ \(\frac{\mathrm{d}(\mathrm{MC})}{\mathrm{d} \mathrm{x}}\) >0
The conditions are explained below diagrammatically,
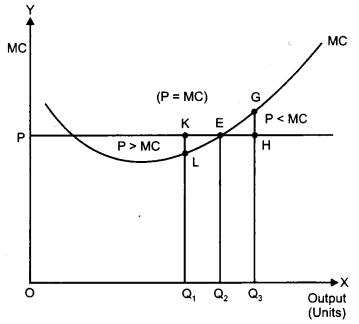
(i) Condition 1: MR = MC
If price is greater than MC, then a firm can increase profit by increasing the production. At output OQ
1
, price is KQ
1
and the marginal cost is LQ
1
, such that KQ
1
> LQ
1
. Therefore, OQ
1
is not the profit maximizing output. This is due to the fact that the firm can increase its profit by increasing the production of output to OQ
2
.
On the other hand, if price is less than MC the firm can increase profit by lowering the production. At output OQ 3 is not the profit maximizing output. This is because the firm can increase its profit by reducing its output level to OQ 2 .
(ii) Condition 2 : MC curve should be rising at the point of intersection with MR
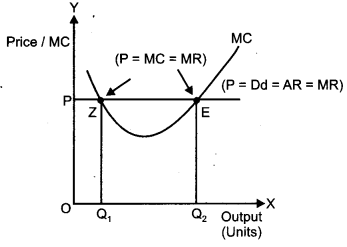
In the diagram, the MC curves cuts the price line (or MR) at two different points i.e., at ‘Z’ and ‘E’. The first order condition of profit maximization, i.e., Price (or MR = MC) is fulfilled at both these points.
At point Z:
MC is falling and is negatively sloped. Any slight increase in the output would imply that the price exceeds MC. This implies that the firm can increase profit by increasing the production.
At point E:
MR is equal to MC and also MC is rising. Any deviation from this point results in a lowering of profit for the firm.
Thus, both the first order condition (MR = MC) and the second order condition (MC curve should be rising at the point of intersection with MR) are satisfied at point E. Hence, point E is the equilibrium point.
Question 15.
Explain the conditions of consumer’s equilibrium with the help of the Indifference Curve Analysis. [6]
Answer:
According to this approach, a consumer attains equilibrium at the point where the budget line is tangent to the indifference curve. This optimum point is characterized by the following inequality:
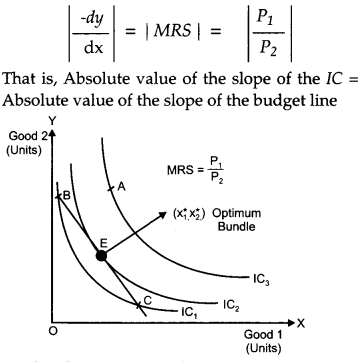
In the figure given above, point E depicts consumer equilibrium. At this point, the budget line is tangent to the indifference curve. The optimum bundle is denoted by \(\left(x_{1}^{*}, x_{2}^{*}\right)\). This point is the optimum or the best possible point.
All other points lying on the budget line (such as point B and point C) are inferior to \(\left(x_{1}^{*}, x_{2}^{*}\right)\) as they lie on a lower IC. Thus, the consumer can rearrange his consumption and again reach equilibrium where the marginal rate of substitution is equal to the price ratio.
At points such as B, MRS is greater than the price ratio (i.e., MRS > \(\frac{P_{1}}{P_{2}}\) ). In this case, the consumer would give up Pome amount of good 2 to increase the consumption of good 1 such that the equality between price ratio and MRS is again reached.
On the other hand, at point such as C, MRS is less than price ratio (i.e., MRS < \(\frac{P_{1}}{P_{2}}\) ). In this case the consumer would give up some amount of good 1 to increase the consumption of good 2 so that MRS again equals price ratio.
Question 16.
Market for a good is in equilibrium. There is . ‘increase’ in supply of the good. Explain the chain of effects of this change. Use diagram. [6]
OR
Distinguish between ‘non-collusive’ and ‘collusive’ oligopoly. Explain the following features of oligopoly:
(i) Few firms
(ii) Non-price competition
Answer:
Market equilibrium is a state or a position where market demand equals market supply. Now, if the market supply increases, then it results in a change in the equilibrium.
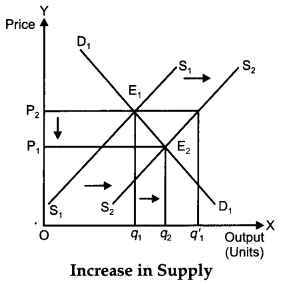
In the above figure, the initial demand curve is D
1
D
1
and the initial supply curve is S
1
S
1
. The initial equilibrium is at point Ey where the equilibrium price is OP
2
and the equilibrium output is Oq
1
.
Now, with the increase in market supply (say, due to a fall in the input prices), the supply curve parallel rightwards to S
2
S
2
from S
1
S
1
.
Holding demand unchanged, at the initial price OP
2
, there exist excess supply equivalent to (Oq
1
‘ – Oq’
1
) units of output. This excess supply will increase competition among the producers and consequently they would be willing to sell their output at a lower price. The price will continue to fall until it reaches OP
1
where, the new supply curve S
2
S
2
intersects the initial demand D
1
D
1
. The new equilibrium is established at point E
2
, where the equilibrium output is Oq
2
and the equilibrium price is OP
1
. At the new equilibrium E
2
,
Equilibrium output has increased from Oq
1
to Oq
2
Hence, an increase in supply with demand remaining constant, results in rise in the equilibrium quantity and a fall in equilibrium price.
OR
| Collusive Oligopoly | Non-collusive Oligopoly |
| Under this form of oligopoly, firms might decide to collude together and not to compete with each other. | In this form of oligopoly, firms do not collude and instead compete with each other. |
| Under collusive oligopoly, the firms would behave as a single monopoly with an aim of maximizing their collective profits rather than their individual profits. | Under non-collusive oligopoly, each firm aims at maximizing its own profits and decides how much quantity to produce assuming that the other firms would not change their quantity supplied. |
Few Large Firms: There exists few but large and dominating firms. These firms account for majority of market supply, thereby control the market price and quantity of the output.
Non-Price Competition: In an oligopoly market structure, all the firms take their price and output decisions keeping in mind the decision taken by their competitors. In this process of making their price and output decisions, firms also indulge in some strategic behaviour in order to compete with their competitors. To survive in the cutthroat competition, firms incur heavy selling costs, such as, advertisement expenditures to convince and attract the consumers to buy the products.
Section – B
Question 17.
What are stock variables? [1]
Answer:
A stock variable is measured at one specific time, and represents a quantity existing at that point in time (say, March 31, 2017), which may have accumulated in the past. A flow variable is measured over an interval of time. Therefore a flow would be measured per unit of time (say a year). Flow is roughly analogous to rate or speed in this sense.
Question 18.
Define ‘Depreciation’. , [1]
Answer:
Depreciation means decline in the value of fixed capital goods, e.g., wear and tear of machines during production process.
Question 19.
Define ‘Statutory Liquidity Ratio’. [1]
Answer:
Statutory liquidity ratio (SLR.) refers to the amount that the commercial banks require to maintain in the form of gold or government approved securities before providing credit to the customers. Here by approved securities we mean, bond and shares of different companies. Statutory Liquidity Ratio is determined and maintained by the Reserve Bank of India in order to control the expansion of bank credit.
Question 20.
Define Money. [1]
Answer:
An officially-issued legal tender generally consisting of currency and coin. Money is the circulating medium of exchange as defined by a government.
Question 21.
What is foreign exchange? [1]
Answer:
In finance, an exchange rate (also known as a foreign-exchange rate, forex rate, FX rate or Agio) between two currencies is the rate at which one currency will be exchanged for another. It is also regarded as the value of one country’s currency in terms of another country’s currency.
Question 22.
Which transactions determine the balance of trade? When is balance of trade in surplus? [3]
Answer:
The transaction of the visible items of home country with rest of the world determine the balance of trade. This can be stated in different words as the balance of exports and balance of imports of all the physical goods of a country determines the balance of trade. The balance of trade is in surplus when export of visible items exceeds import of visible items.
Question 23.
Explain how ‘non-monetary exchanges’ are a limitation in taking gross domestic product as an index of welfare. [3]
Answer:
A non-monetary exchange occurs when an entity receives goods or services from an external entity in exchange. This is because GDP does not take into account those transactions that cannot be expressed in the monetary terms. Often, in the less developed countries, there exists a large number of non-monetary exchanges, particularly in the rural areas and household sector. For example, farm labour paid in terms of food grains. Such transactions as cannot be expressed in the monetary terms remain uncaptured by GDP. Consequently, the value of GDP remains underestimated. In this sense, GDP cannot be considered as an index of economic welfare.
Question 24.
In an economy the marginal propensity to consume is 0.75 investment expenditure in the economy increases by ₹ 75 crore. Calculate the total increase in national income. [3]
Answer:
Given:
MPC = 0.75
Δl = 75
To calculate : Δ Y
We know,
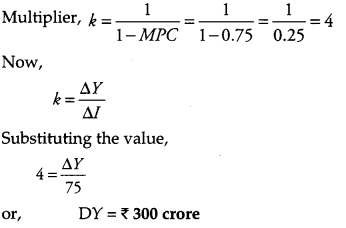
Thus with an increase in the investment expenditure by ₹ 75 crores, National Income increased by ₹ 300 crore.
Question 25.
Explain the distinction between voluntary and involuntary unemployment. [3]
Answer:
|
Voluntary Unemployment |
Involuntary Unemployment |
| (i) If refers to a situation where a person who is able to work remains unemployed due to his/her own willingness. | It refers to a situation where a person who is willing and is able to work does not get work at the existing wage rate. |
| (ii) In this situation, the person remains unemployed despite the jobs being avail¬able in the market. | In this situation, the person remains un-employed due to non-availability of the job in the market. |
Question 26.
When price of a foreign currency falls, the demand for that foreign currency rises. Explain why. [3]
OR
When price of a foreign currency falls, the supply of that foreign currency also falls. Explain? Why?
Answer:
When the price of foreign currency falls then it implies that foreign goods have become cheaper for the domestic residents of a country. As a result, the demand for the foreign goods by the domestic residents rises, which rises the demand for foreign currency as well.
For example, suppose the rupee-dollar exchange rate (price of dollars in terms of rupees) falls from say, from $1 = ₹ 50 to $1 = ₹ 48. This implies that in order to purchase one dollar worth of goods domestic residents now have to pay ₹ 48 instead of ₹ 50. As a result, demand for the foreign goods increases and the demand for dollars also rises.
OR
When the price of foreign currency falls, then this implies that the domestic goods have become expensive for the foreign residents. This is because they can now buy less goods and services with the same worth of the foreign currency. As a result, the foreign demand for the domestic products falls. This leads to a fall in the exports of the native country. With fall in the exports, the native country receives less foreign currency, thereby, reduces the supply of foreign currency in the economy. For example, suppose the rupee-dollar exchange rate (price of dollars in terms of rupees) falls from say, from $1 = ₹ 70 to $1 = ₹ 68. This implies that the foreign residents can now buy only ₹ 68 worth of goods with one dollar. Thus, the demand for domestic goods falls and the supply of dollars also falls.
Question 27.
Explain the ‘redistribution of income’ objective of a government budget. [4]
OR
Explain the ‘economy stability objective of a government budget.
Answer:
Redistribution of income and wealth or redistribution of wealth is the transfer of income, wealth or property from some individuals to others. Government through its budgetary policy attempts to promote fair and right distribution of income in an economy. This is done through taxation and expenditure policy. Through its taxation policy, government levies taxes on the higher income groups in the economy and transfers the purchasing power (so extracted) to the poor sections of the society through its expenditure policy (subsides, transfer payments, etc.). Thus, with the help of the taxation and expenditure policy, government aims at redistribution of income such that a fair and just distribution of income is achieved in the society.
OR
Ensuring economic stability is one of the important objectives of a government budget. Government aims at insulating the economy from major economic fluctuations (such as inflation, unemployment, etc.) and the business cycles such as boom, recession, depression and recovery. It aims at achieving higher economic growth rate while combating such situations. Through the budget policy, government aims at maintaining price and employment stability. This state of economic growth with stability ensures a smooth and efficient functioning of an economy.
Question 28.
From the following data about a government budget find (a) revenue deficit, (b) fiscal deficit and (c) primary deficit
|
s. No. |
Items | (₹ Arab) |
| (i) | Tax revenue | 47 |
| (ii) | Capital receipts | 34 |
| (iii) | Non-tax revenue | 10 |
| (iv) | Borrowings | 32 |
| (v) | Revenue expenditure | 80 |
| (vi) | Interest payments | 20 |
Answer:
(a) Revenue Deficit = Revenue Expenditure – Revenue Receipts
Where, Revenue Receipts = Tax Revenue + Non Tax Revenue
= (v) – (i) – (iii)
= 80 – 47 – 10 = ₹ 23 Arab.
(b) Fiscal Deficit – Revenue Expenditure – Revenue Receipts + Capital Expenditure – Capital Receipts Net of Borrowings
= Revenue Expenditure — Tax Revenue – Non- tax Revenue – (Capital Receipts – Borrowings)
= (v) – (i) – (iii) [(ii) – (iv)]
= 80 – 47 – 10 – (34 – 32)
= 112 – 91 =₹ 21 Arab.
(c) Primary deficit = Fiscal Deficit – Interest Payments
= 21 – 20
= ₹ 1 Arab.
Question 29.
Giving reasons, explain the treatment assigned to the following while estimating National Income:
(i) Family members working free on the farm owned by the family.
(ii) Payment of interest on borrowings by general government. [4]
Answer:
(i) It would be not be included in National Income because production for self ‘ consumption is not included is the estimation of National Income.
(ii) It would not be included because it is a non-factor payment and it doesn’t relate to flow of goods and services.
Question 30.
Explain the role of the following in correcting the inflationary gap in an economy: [6]
(i) Legal reserves (ii) Bank rate
OR
Explain the role of the following in correcting the deflationary gap in an economy:
(i) Open market operations (ii) Margin requirements
Answer:
The situation of inflationary gap rises when equilibrium is established after the stage of full employment. The excess of aggregate demand over aggregate supply at the full employment level is inflationary gap. For bringing equality between AD and AS at the full employment level AD has to be reduced because AS cannot be increased since all the resources are fully employed.
(i) Legal reserves: Legal reserves refers to a minimum percentage of deposits commercial banks have to keep as cash either with themselves or with the central bank. The central bank has the power to change it. When there is inflationary gap the central bank can raise the minimum limit of these reserves so that less funds are available to the banks for lending. This will reduce Aggregate Demand.
(ii) Bank rate: Bank rate is the rate of interest which central bank charges from commercial banks for giving them loans. If banks rate is increased, the rate of interest for general public also goes up and this reduces the demand for credit by the public for investment and consumption. Therefore, for controlling the situation of inflationary gap, bank rate is increased. This ultimately will lead to the decline in the demand for credit. Decline in the volume of credit as a component of money supply will have controlling pressure on inflationary forces.
OR
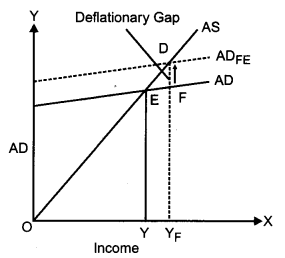
The situation of deflationary gap arises when equilibrium is established before the stage of full employment. In this case, the full employment level, aggregate demand is less than aggregate supply. In Diagram, DF is the deflationary gap. For removing deflationary gap, the level of aggregate demand needs to be increased to match the aggregate supply.
(i) Open market operations: This means the sale and purchase of securities by the central bank which are bought and sold by the commercial banks to correct deflationary gap. Credit as a component of money supply needs to be increased. For achieving this central bank buys securities from commercial banks in lieu of which cash flow or liquidity position of commercial banks improves and their lending capacity is raised. People can borrow more. This will raise AD.
(ii) Margin requirements: Commercial banks never advance loans to its customers equal to the full value of collateral or securities. They always keep a margin with them, such as keeping a margin of 20% and advancing loans equal to 80% of the value of security.
In dealing with deflationary gap, this margin is reduced so that more credit may be made available against the security. This increases borrowing capacity of borrowers and thus will raise AD.
Question 31.
Explain the following functions of the central bank:
(i) Bank of issue (ii) Banker’s bank [6]
Answer:
(i) Bank of issue: Bank of issue refers to the legal right to issue currency. The central bank enjoys complete monopoly of note issue. This ensures about uniformity in note circulation. At the same time, it gives the central bank power to influence money supply because currency with public is a part of money supply.
(ii) Banker’s bank: Central bank is the bank of banks. This signifies that it has the same relationship with commercial banks in the country which commercial banks have with their customers. It keeps their required cash in reserve, provides them financial securities, gives them advice and discounts their bills and securities held by them. It also gives them loan in times of emergency.
Question 32.
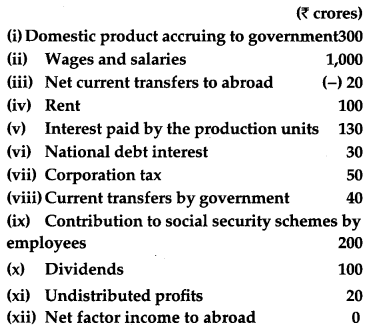
Calculate (a) ‘Net Domestic ProductatFactor Cost’ and (ii) ‘Private Income**’ from the following: [6]
Answer:
(a) NDP
FC
= wages & salary + contribution to social seunit of scheme + Rent +’ Interest + corporation tax + Dividend + Undistributed profit.
= Wages and salaries + Rent + Interest paid by production units + Corporation tax + Contribution to social security schemes by employers + Dividends + Undistributed profits
= (ii) + (iv) + (v) + (vii) + (ix) + (x) + (xi)
= 1,000 + 100 + 130 + 50 + 200 + 100 + 20 = ₹ 1,600 crores
CBSE Previous Year Question Papers Class 12 Economics 2011 Outside Delhi Set – II
Note: Except the following questions, remaining all the questions have been asked in previous sets.
Section – A
Question 7.
Calculate price elasticity of demand :
| P | Q |
| 12 | 24 |
| 14 | 20 |
Answer:
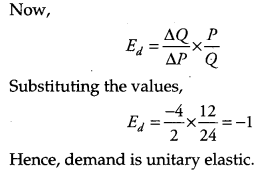
Question 15.
Explain any three properties of Indifference Curves. [6]
Answer:
Indifference Curve (IC) is a curve that depicts various combinations of two goods that provides a consumer with the same level of satisfaction. The following are the three major properties of an IC.
(i) Indifference curve is downward sloping to the right: Downward slope of an IC to the right implies that a consumer cannot simultaneously have more of both the goods. An increase in the consumption of one good is possible only with the reduced consumption of another good.
(ii) Slope of IC: The slope of an IC is given by the Marginal Rate of Substitution (MRS). It refers to the rate at which a consumer is willing to substitute one good for each additional unit of another good.
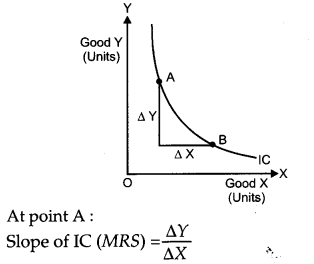
i.e., MRS shows the rate at which the consumer is willing to sacrifice good Y for an additional unit of good X.
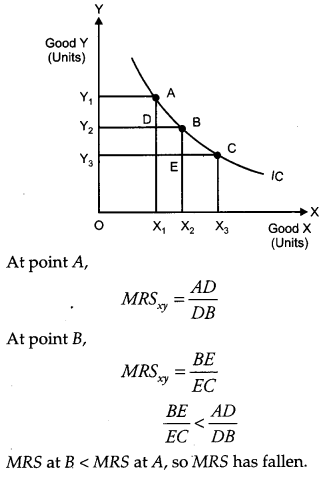
(iii) Shape of indifference curve: An IC is convex to the origin. As we move down along the IC to the right, the slope of IC (or MRS) decreases. This is because as the consumer consumes more and more of one good, the marginal utility of that good falls. On the other hand, the marginal utility of the (other) good which is sacrificed rises. In other words, the consumer is willing to sacrifice lesser and lesser for each additional unit of the other good consumed. Thus, as we move down the IC, MRS diminishes. This suggests the convex shape of indifference curve.
Section – B
Question 22.
List the transactions of Current Account of the
Balance of Payments Account. [3]
Answer:
The following are the three main transactions of the Current Account of BOP.
(i) Export and Import of Goods: The transaction related to the export and import of goods are recorded in the Current Account of BOP. This record of exports and imports is also termed as ‘Balance of Visible Trade’. The export of goods is recorded as positive items whereas, the import of goods are recorded as negative items in the Current Account of BOP.
(ii) Export and import of services: The second component of the Current Account is the export and import of services. The record of export and import of services is also termed the ‘Balance of Invisible Trade’. Similar to the export of goods, export of services is recorded as positive items in the Current Account of BOP. Some of the major services that are included in the Current Account are shipping services, insurance and banking services, income from investment (i.e., income from profits and dividends), foreign travel, miscellaneous transactions such as royalties, consultancy services, telephone services, etc.
(iii) Unilateral transfer: Unilateral transfers refer to the one-sided transfer such as gifts, donations, grants from foreign governments, etc. A country makes such transfers to the rest of the world as well as receives transfers from the rest of the world. The receipts of unilateral transfers are recorded as positive items in the Current Account, whereas, the payments of unilateral transfers are recorded as negative items in the Current Account of BOP.
Question 24.
In an economy the marginal properity to save is 0.4. National income in the economy increases by ₹ 200 crore as a result of change in investment. Calculate the change in investement. [3]
Answer:
Given, Marginal propensity to save (MPS) = 0.4
Change in investment = ₹ 80 crore.
We know that,

Change in investment = ₹ 80 crore
Question 29.
Giving reasons and explain the treatment assigned to the following while estimating national income: [4]
(i) Social security contributions by employees.
(ii) Pension paid after retirement.
Answer:
(i) Social security contributions by employees should be included in the estimation of national income as it is part of compensation of an employee.
(ii) Pension paid after retirement should be included in the estimation of national income. This is because it is a part of compensation of employees.
Question 32.
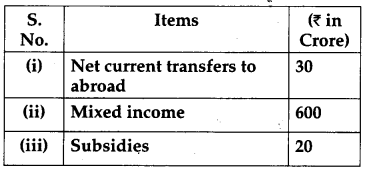
Calculate (a) ‘Net National Product at Market Price’ (b) ‘Private Income**’ from the following: [6]
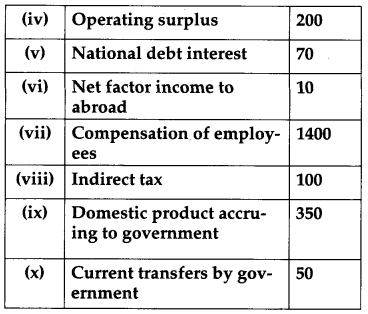
Answer:
NNP
MP
= Compensation of Employees + Operating Surplus + Mixed Income + (Indirect Tax – Subsides) – Net Factor Income to Abroad
= 1400 + 200 + 600 + (100 – 20) -10
= ₹ 2,270 crore
CBSE Previous Year Question Papers Class 12 Economics 2011 Outside Delhi Set – III
Note: Except for the following questions, all the remaining questions have been asked in previous sets.
Section – A
Question 1.
Define macroeconomics. [1]
Answer:
Macroeconomics is that branch of economics, which deals with the economic activities performed by all the sectors facing economic problems and different situations for a country (economy) as a whole.
Question 7.
From the following data calculate price elasticity of demand
| Price (₹) | Demand (units) |
| 9 | 100 |
| 9 | 150 |
Answer:
Given,
Initial Price, P = 9
Initial Quantity demanded, Q = 100
Final Price, P
1
= 9
Final Quantity demanded, Q
1
= 150
ΔP = (P
1
– P) = (9 – 9) = 0 and,
ΔQ = (Q
1
– Q) = (150 – 100) = 50
Now,
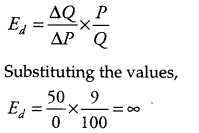
Hence, demand is Perfectly Elastic.
Question 11.
Explain the law of diminishing marginal utility with the help of a total utility schedule. [4]
Answer:
Law of Diminishing Marginal Utility states that as a consumer consumes more and more units of a commodity at succession, then the Marginal Utility derived from the consumption of each additional unit of the commodity falls.
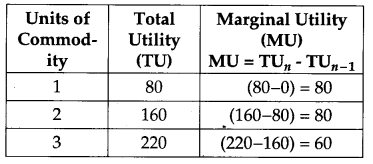

From the above schedule, it can be observed that for two units of consumption, marginal utility is 80. For the third unit, the marginal utility falls to 60. For the fourth unit, the marginal utility further falls to 50 and so on. Thus, as more and more units of a commodity are consumed, the marginal utility derived from the consumption of each additional unit falls.
Question 15.
Explain the concepts of (i) marginal rate of substitution and (ii) budget line equation with the help of numerical examples. [6]
Answer:
(i) Marginal Rate of Substitution (MRS) refers to the rate at which a consumer is willing to substitute one good for each additional unit of . the other good. Algebraically,
MRS = \(\frac{\Delta Y}{\Delta X}\)
It shows how many units of good Y the consumer is willing to sacrifice to gain one additional unit . of good X.
The following schedule explains the concepts of MRS:
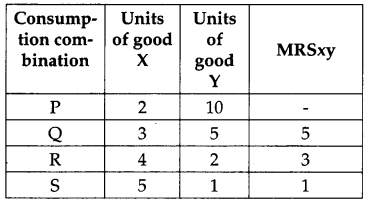
As the consumer moves from consumption combination P to consumption combination Q, consumption of good X increases from 2 units to 3 units while, the consumption of good Y falls from 10 units to 5 units. That is to gain one additional unit of good X, the consumer sacrifices 5 units of good Y. Thus, the MRS is 5. Similarly, as the consumer moves from point R to point S, he is willing to sacrifice only one unit of good Y for one additional unit of good X. Thus, MRS is 1.
(ii) Budget line is a line that represents the different combinations of two goods that are affordable and are available to a consumer given his/her level of income and the market prices of the goods if the consumer spends his entire
income on the two goods.
The equation of the budget line is represented as follows:
P
1
x
1
+ P
2
x
1
= M
For example, consider a consumer who has income (M) of ₹ 100. He wants to purchase two goods, good 1 and good 2. Good 1 costs (P
1
) per unit, while good 2 costs (P
2
) ₹ 4 per unit. In this case, the budget line is of the form,
5x
1
+ 4 x
2
= 100
Section – B
Question 22.
Distinguish between balance of trade and balance on current account of balance of payments. [3]
Answer:
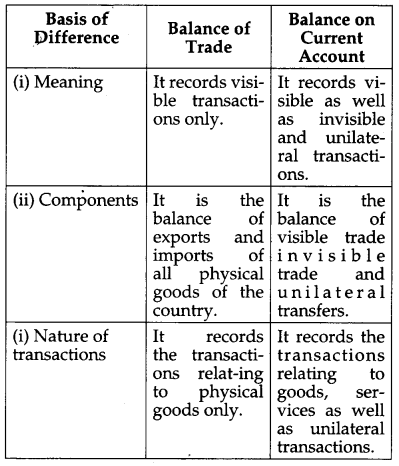
Question 24.
As a result of increase in investment by ₹ 60 crore, national income rises by ₹ 240 crore. Calculate marginal propensity to consume. [3]
Answer:
DI = 60
DY = 240
To Calculate: MPC
We know,
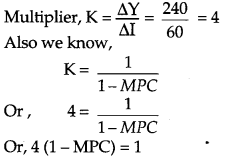
Or, MPC = 0.75
Question 29.
Giving reasons, explain the treatment assigned to the following while estimating National Income. [4]
(i) Expenditure on maintenance of a building.
(ii) Expenditure on adding a floor to the building.
Answer:
(i) Expenditure on maintenance of a building will not be included in the National Income because it is not adding anything in capital formation.
(ii) Expenditure on adding a floor to tlye building will be included in the National Income because it is a part of domestic capital formation.
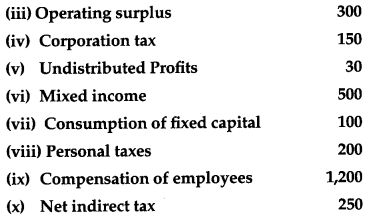
Question 32.
Calculate (a) “Gross National Product at market place’ and (b) “Personal Disposable Income’ from the following**: [6]

Answer:
(a) GNP
MP
= Compensation of employees + Mixed Income + Operating surplus + consumption of fixed capital + Net indirect tax – Net factor income to abroad
= (ix) + (vi) + (iii) + (vii) + (x) – (i)
= 1,200 + 500 + 300 + 100 + 250 – 10
= 2,350 – 10 = ₹ 2,340 crores